Trying to find our unicorn…Frustrating and inspiring — a nice summary of the last couple weeks.
On one hand we now have a group of customers getting value out of polljoy — a huge relief and strengthened the belief we’re onto something…
On the frustrating side, we still face a challenge trying to communicate to new homepage visitors.
The site bounce rate (some days over 80% — ugh!) roughly translates to“looks nice, but what do you really do?”
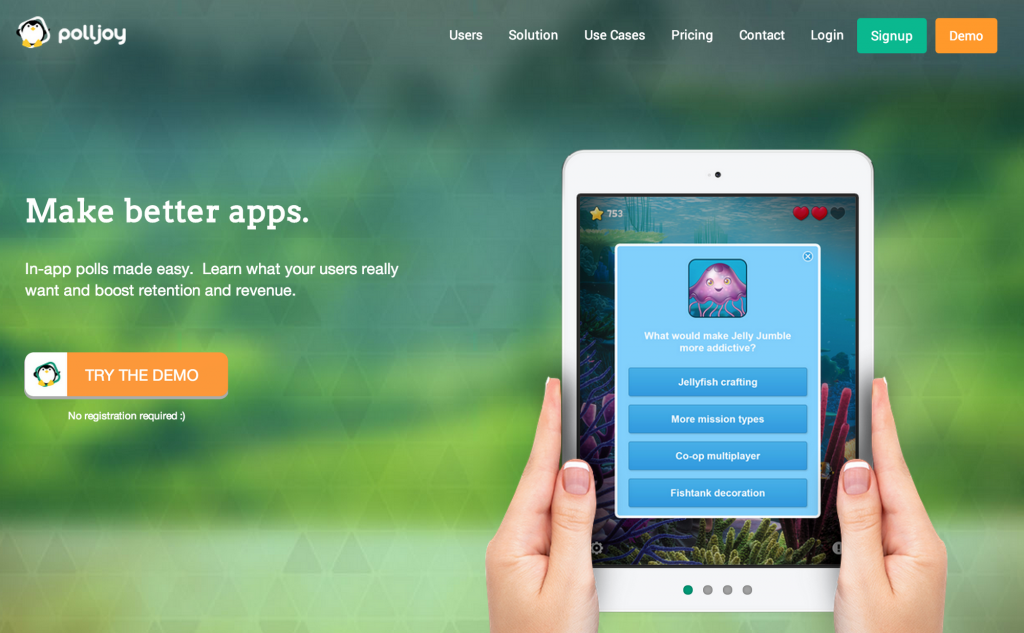
Our first homepage
Some think we are a kids game company. Or market research network. Most don’t get what polljoy is and importantly how does it help them.
But which message do we use on the homepage? Especially as we have lots (over 15!).

Unicorn hunting. Photo thanks to Ildar Sagdejev
We decided to find the best message (our “unicorn”) through polls (more on that next time) and also: email AB testing.
What we did — we first crafted 10 different email templates with a common subject line: “Suggestions for your game” and varying email bodies.
When we sent it to a group of mobile game developers over a week and plotted out the resulting click through rates:

Seeing this graph in black and white suddenly made things clearer.
The #1 performer came out of left field:
“…I believe your game can be improved by giving users extra of your virtual currency”
That one to be honest is a bit of a mystery. It could have been because they were intrigued about our analysis of their game balancing, or some other reason— we need to peel the onion further on this.
#2 was telling – a direct message about not losing players:
“…I believe it can be improved by finding out why players leave and don’t return. Something statistics can’t often answer.”
This makes a lot of sense. After all the majority of app users don’t stick to an app for more than one day, and it definitely is a real pain point.
#3 also made sense (everyone wants more 5 star ratings!):
“…encourage happy players to rate your game.”
This makes sense as consumers and platforms really do take the number and average rating into account when deciding whether to download (or their chart position).
Given we don’t fully understand #1 , we’ve decided to update our homepage to new copy that focuses on #2 and #3 — and we’ll see what impact that has on our bounce rate:
FIND OUT WHY YOUR USERS LEAVE AND DON’T RETURN.
Radically improve your app and ratings.
In-app user polls that tell you what statistics can’t.
So what else to test?
Another problem may or may not lie in the layout with example polls on the iPad. We have a suspicion this may be hurting more than hurting. So we’re see what other layouts could work better, and test them out…
We’re also now using polljoy ourselves to delve into more questions we have, with the aim of further improving our homepage — more to report soon.
Startup life does feel like a detective hunt… ☺
ps – if you’re looking to do your own email ab testing, Sendgrid is nifty and lets you easily track delivery, open and click through rates for different variants without a complicated UI. Definitely recommend using it or one of its peers…


